

|
The first attempt to dope the tin atomic sites of
Sn6Ba4Ca2Cu10Oy with
Pb (lead) produced a Tc drop. And the results of Tl (thallium)-doping were ambiguous. However, doping
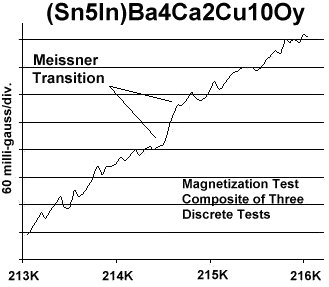
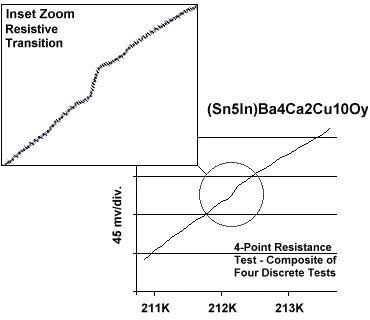
25% of the Sn atomic sites with In (indium) immediately produced two new phases: 208K and
212K. Later, after isolating the 212K formula, a 206K phase also appeared.
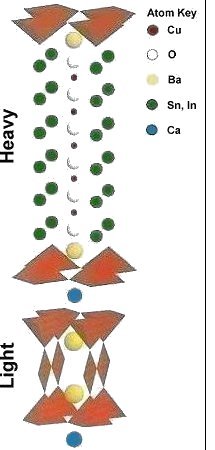
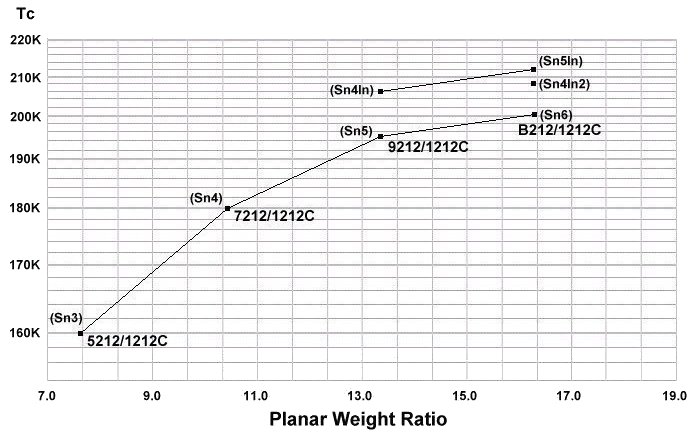
Since 25% of 6 Sn atoms equates to equal amounts of (Sn4In2) and (Sn5In), these were presumed to be the phases generating the 208K and 212K signals. Through trial-and-error, the (Sn5In) phase was then identified as the source of the 212K superconductivity; while the overdoped (Sn4In2) was responsible for the 208K signal. The (Sn5In)Ba4Ca2Cu10Oy structure is believed to be B212/1212C - the same as for Sn6Ba4Ca2Cu10Oy (see graphic at left, where B=11 and C= copper chain). Both the ionic radius and atomic weight of indium are comparable to tin, making it an ideal hole dopant for this compound. The 206K phase appeared only in tests that included a single atom of indium per unit cell. When plotted in accordance with the Tc-v-PWD (planar weight disparity) graph below, the 206K signal was determined to be a result of the 9212/1212C structure type (Sn4In). |
Spotting the superconductivity signature of these minority phases
proved a considerable challenge, as their volume fractions - and, therefore, their signals - were extremely low.
The method used to identify a superconductive transition within a high noise background is shown below.
This magnetization plot shows a Meissner transition appearing near
220K.
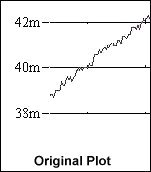
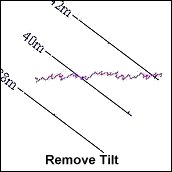
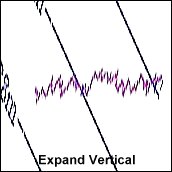
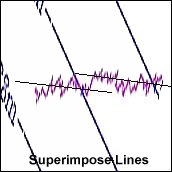
The first step in searching for a sharp transition buried in noise is to rotate the plot (Remove Tilt). Then adjust the aspect ratio so that the vertical is accentuated (Expand Vertical). Lastly, superimpose a line through the average noise and look for a shift in level (Superimpose Lines). Once a level shift is located, multiple tests can be digitally summed together to resolve a signal within that range of temperatures. Summing improves the signal-to-noise ratio (S/N) because the noise adds as a root-mean-square function (being out-of-phase), while the superconductive transitions sum arithmetically (being in-phase). This improves the S/N by 3db with 2 plots, 4.7db with 3 plots, 6db with 4 plots, etc.
Initial variations of the stoichiometry to include more copper suggest the 218K superconductivity signature (220K magnetic shown above) results from a B212/2212C structure type. Tests show that adding another copper atom to the unit cell reduces the 212K signal, while strengthening the 218K signal. To read more on this, click HERE.
Synthesis of these materials was by the solid state reaction method. Stoichiometric amounts of the below precursors were mixed, pelletized and sintered for 36-60 hours at 830C. The pellet was then annealed for 10 hours at 500C in flowing O2.
SnO 99.9% (Alfa Aesar) 4.64 grains* V. Kresin, et al, Phys. Reports 288 - 1997.
The magnetometer employed twin Honeywell SS94A1F Hall-effect sensors with a tandem sensitivity of 50 mv/gauss. The 4-point probe was bonded to the pellet with CW2400 silver epoxy and used 7 volts on the primary.
RESEARCH NOTE: The copper-oxides are strongly hygroscopic. All tests should be performed immediately after annealing.

E. Joe Eck
© 2008 Superconductors.ORG
Patent Pending #61/199,804
All rights reserved.
 BACK to "News" page at Superconductors.ORG